Economic growth
|
Economic Growth
Using graphs to show economic growth
|
Third goal is economic growth
An increase of GDP over time
Different countries go through different levels of economic growth
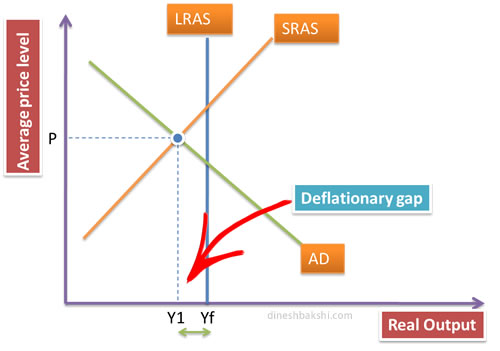
Demand side factors may be used to bring short term growth
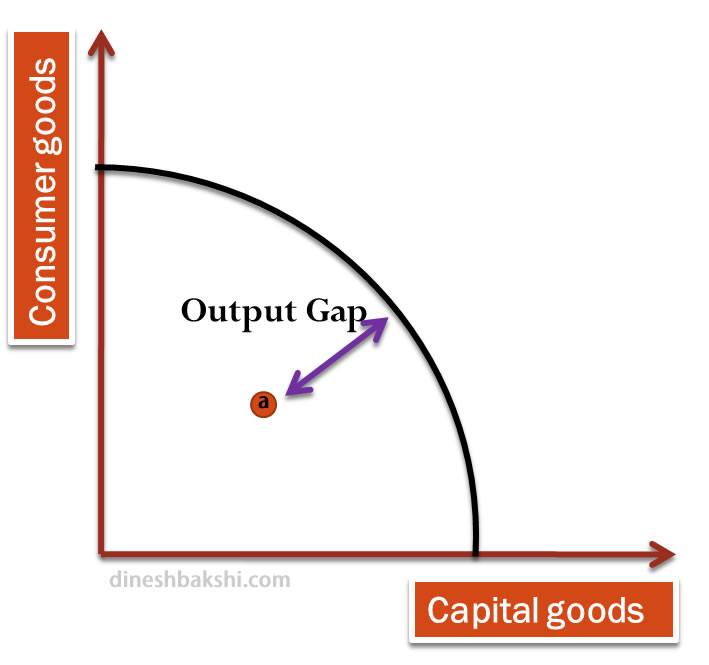
resources are not being used to the fullest extent possible
economic growth is achieved when AD1 shifts right ant a moves to B
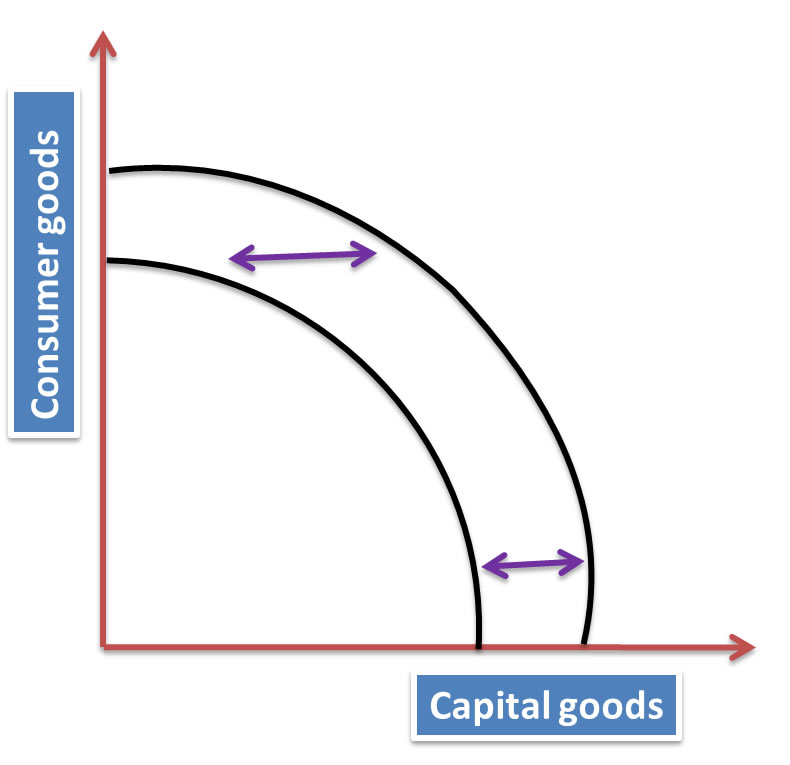
long term as an increase of ouptut or potential output
a shift in the LRASE leading to shift in PPC
|
|
Consequences of economic growth
Positive consequences
|
Brings benefits but also negatives
Aggregate demand tends to increase as pop and incomes grow
This leads to inflation
However when economic growth accurs pushing out the aggregate supply
curve economies can experience non-inflationary growth
Income of the average person will increase and this may be equated
with a higher standard of living.- material living standard have improved
Not only been achieved but led to increases in technology
Lead to higher living standards
lead to higher tax revenues
more money to spend on public goods, merit goods and reduce income inequalities
increase trade with other counties and has a very positive impact on
living standards
There is an increase in education and human capital
|
|
Negative consequences
|
Some argue that an increase in growth does not necessarly mean an
increase in happiness
Sacrifice leisure time, neglect personal relationships
Greater material wants make us more and more unahppy
Structual unemployment occurs as sectors shift
Enviromental destruction, more waste,
Wealthier citizens can demand policies that promote sustainabily
|
|
Summary
|
Deflationary gaps may be the result of a fall in economic growth and
may be solved using demand management policies. supply side policies effect
the business cycle and generate long term growth.
Growth rate= (real gdp in year 2- real gdp in year 2)/real gdp in
year 1)=100
|
No comments:
Post a Comment